Visualping · Product Redesign
Making complex monitoring easier to navigate
A clearer way to manage what matters
Visualping helps people track changes across websites. Its dashboard is where users manage their monitored pages, configure alerts, and review changes. I led the redesign of this core experience, focusing on simplifying navigation, improving everyday workflows, and making monitoring activity easier to understand.
The challenge
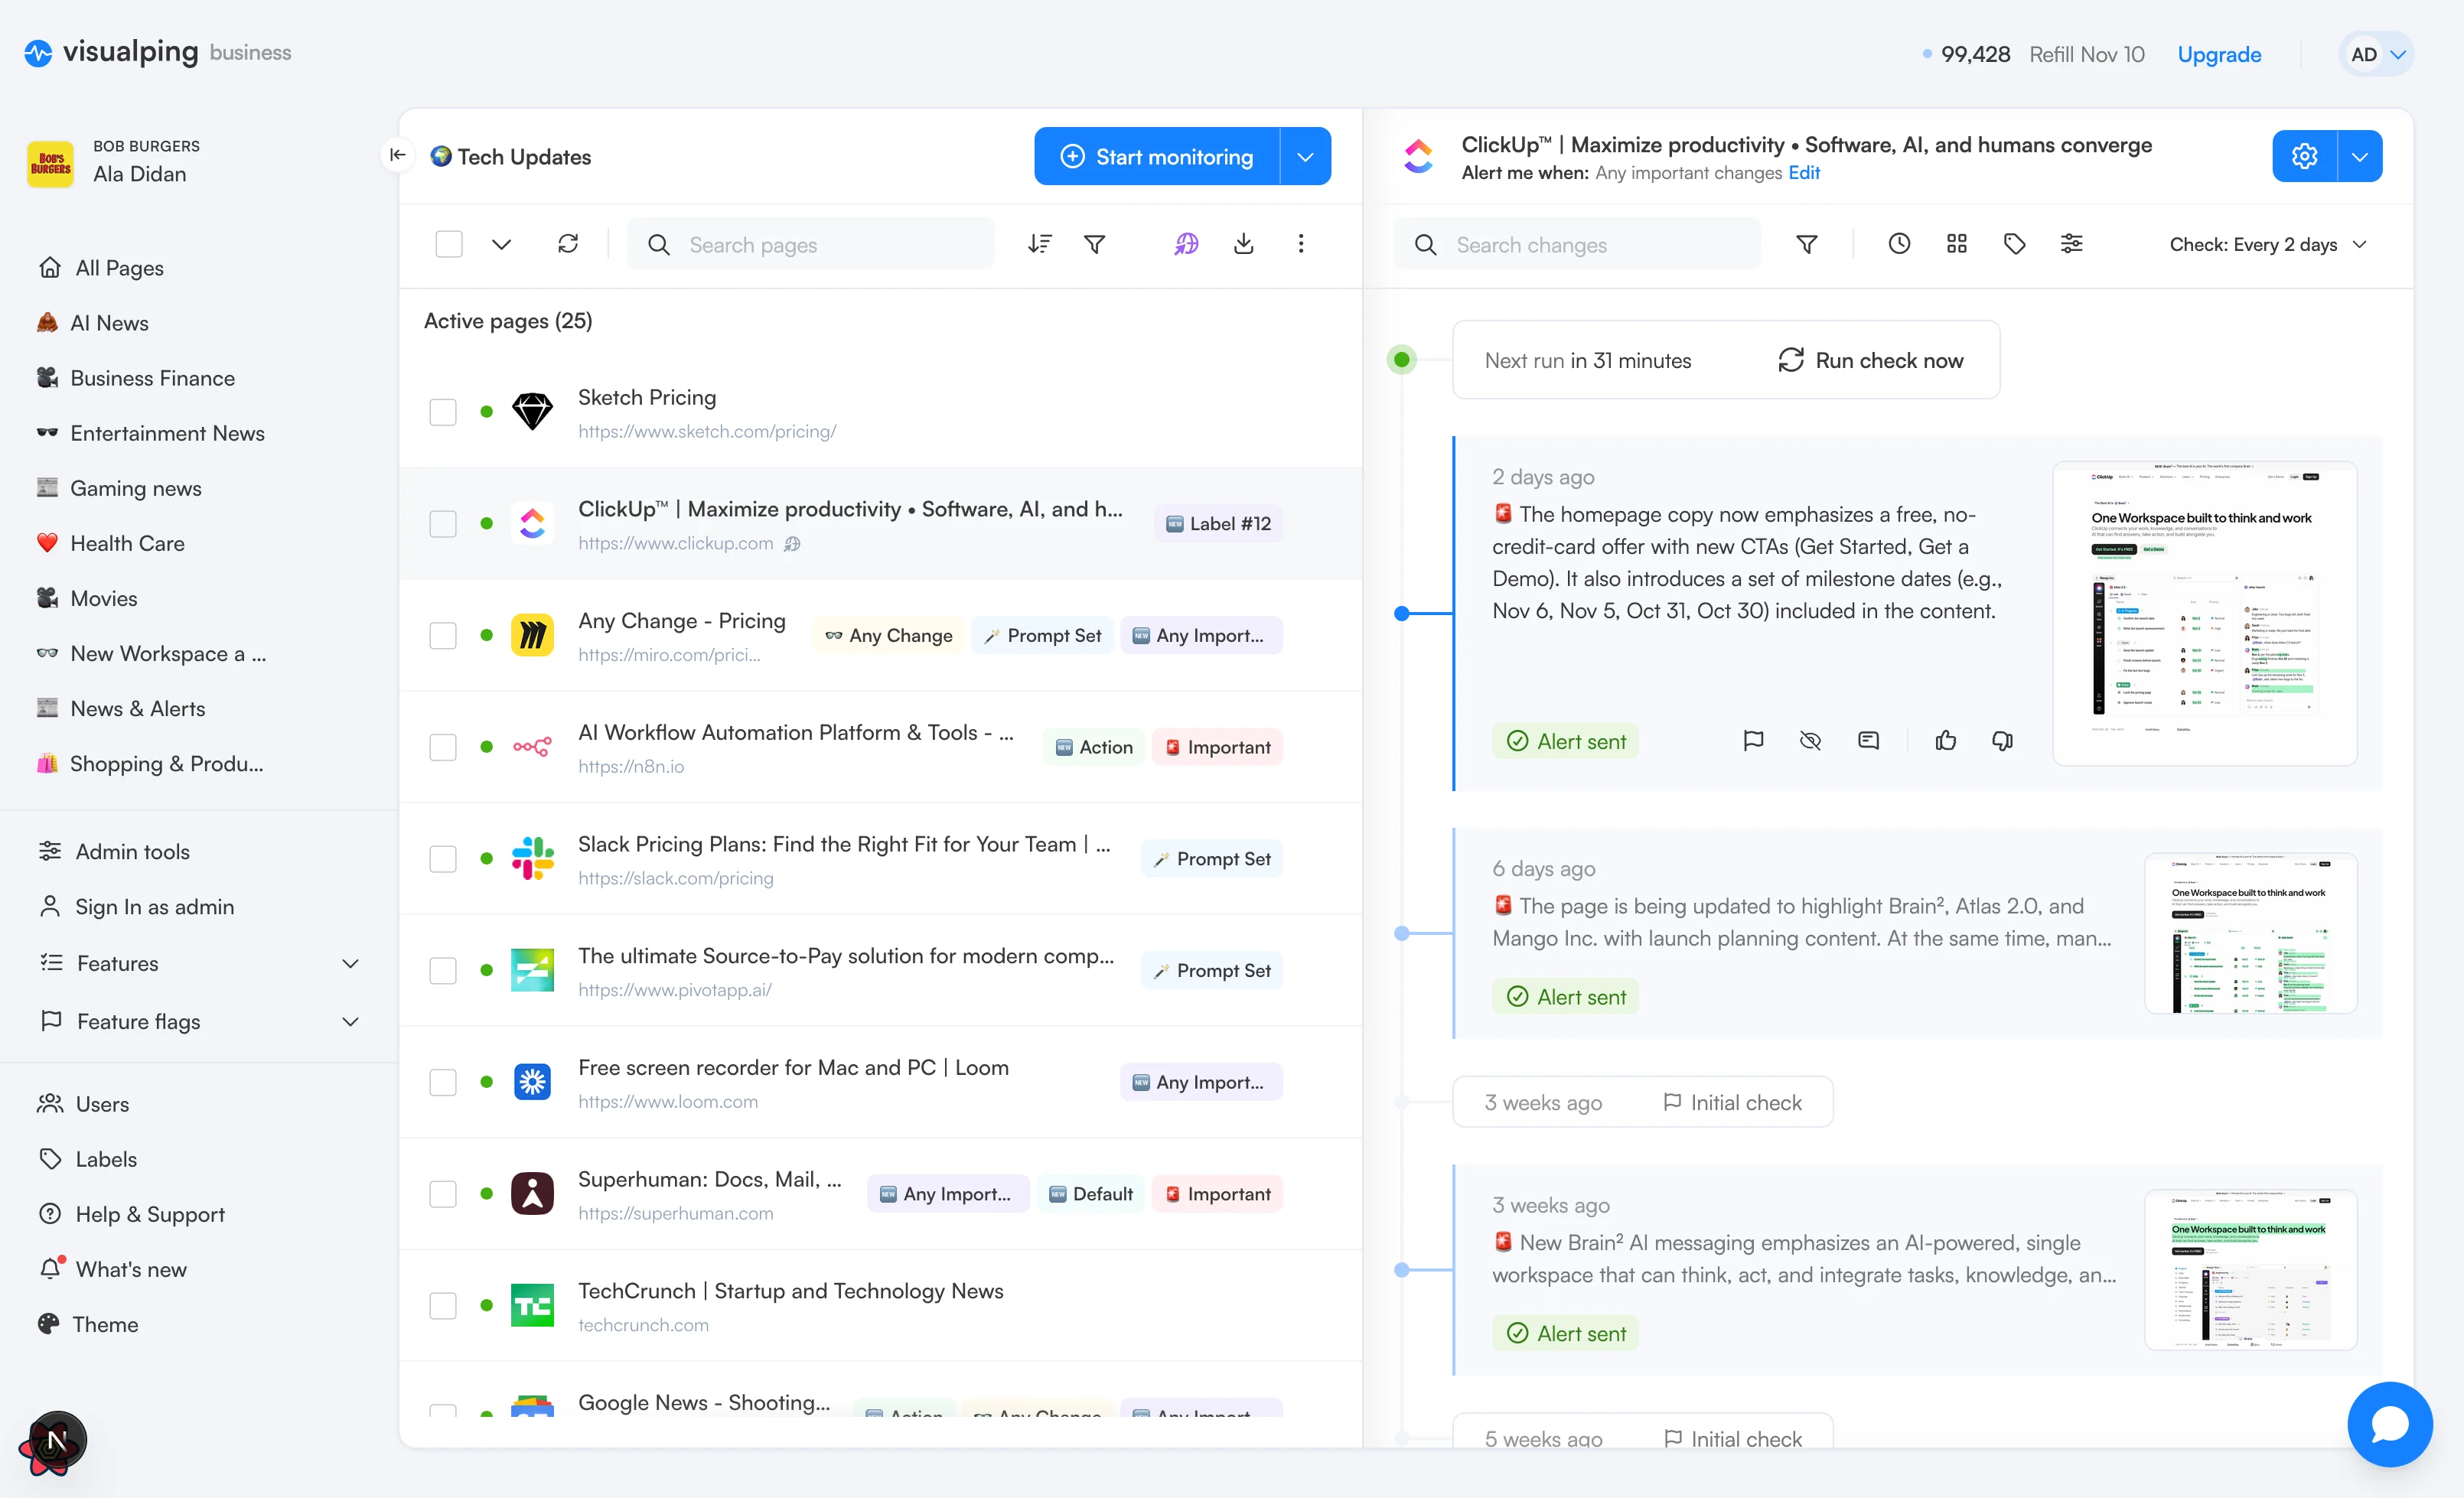
The dashboard had grown visually busy, with competing navigation elements, scattered actions, and limited space for managing monitored pages. Reviewing changes also meant looking at individual events without a complete picture of monitoring activity. The challenge was to make a feature-rich product feel simpler without taking away the controls users rely on.
Sidebar
Navigation should support the work,
not compete with it
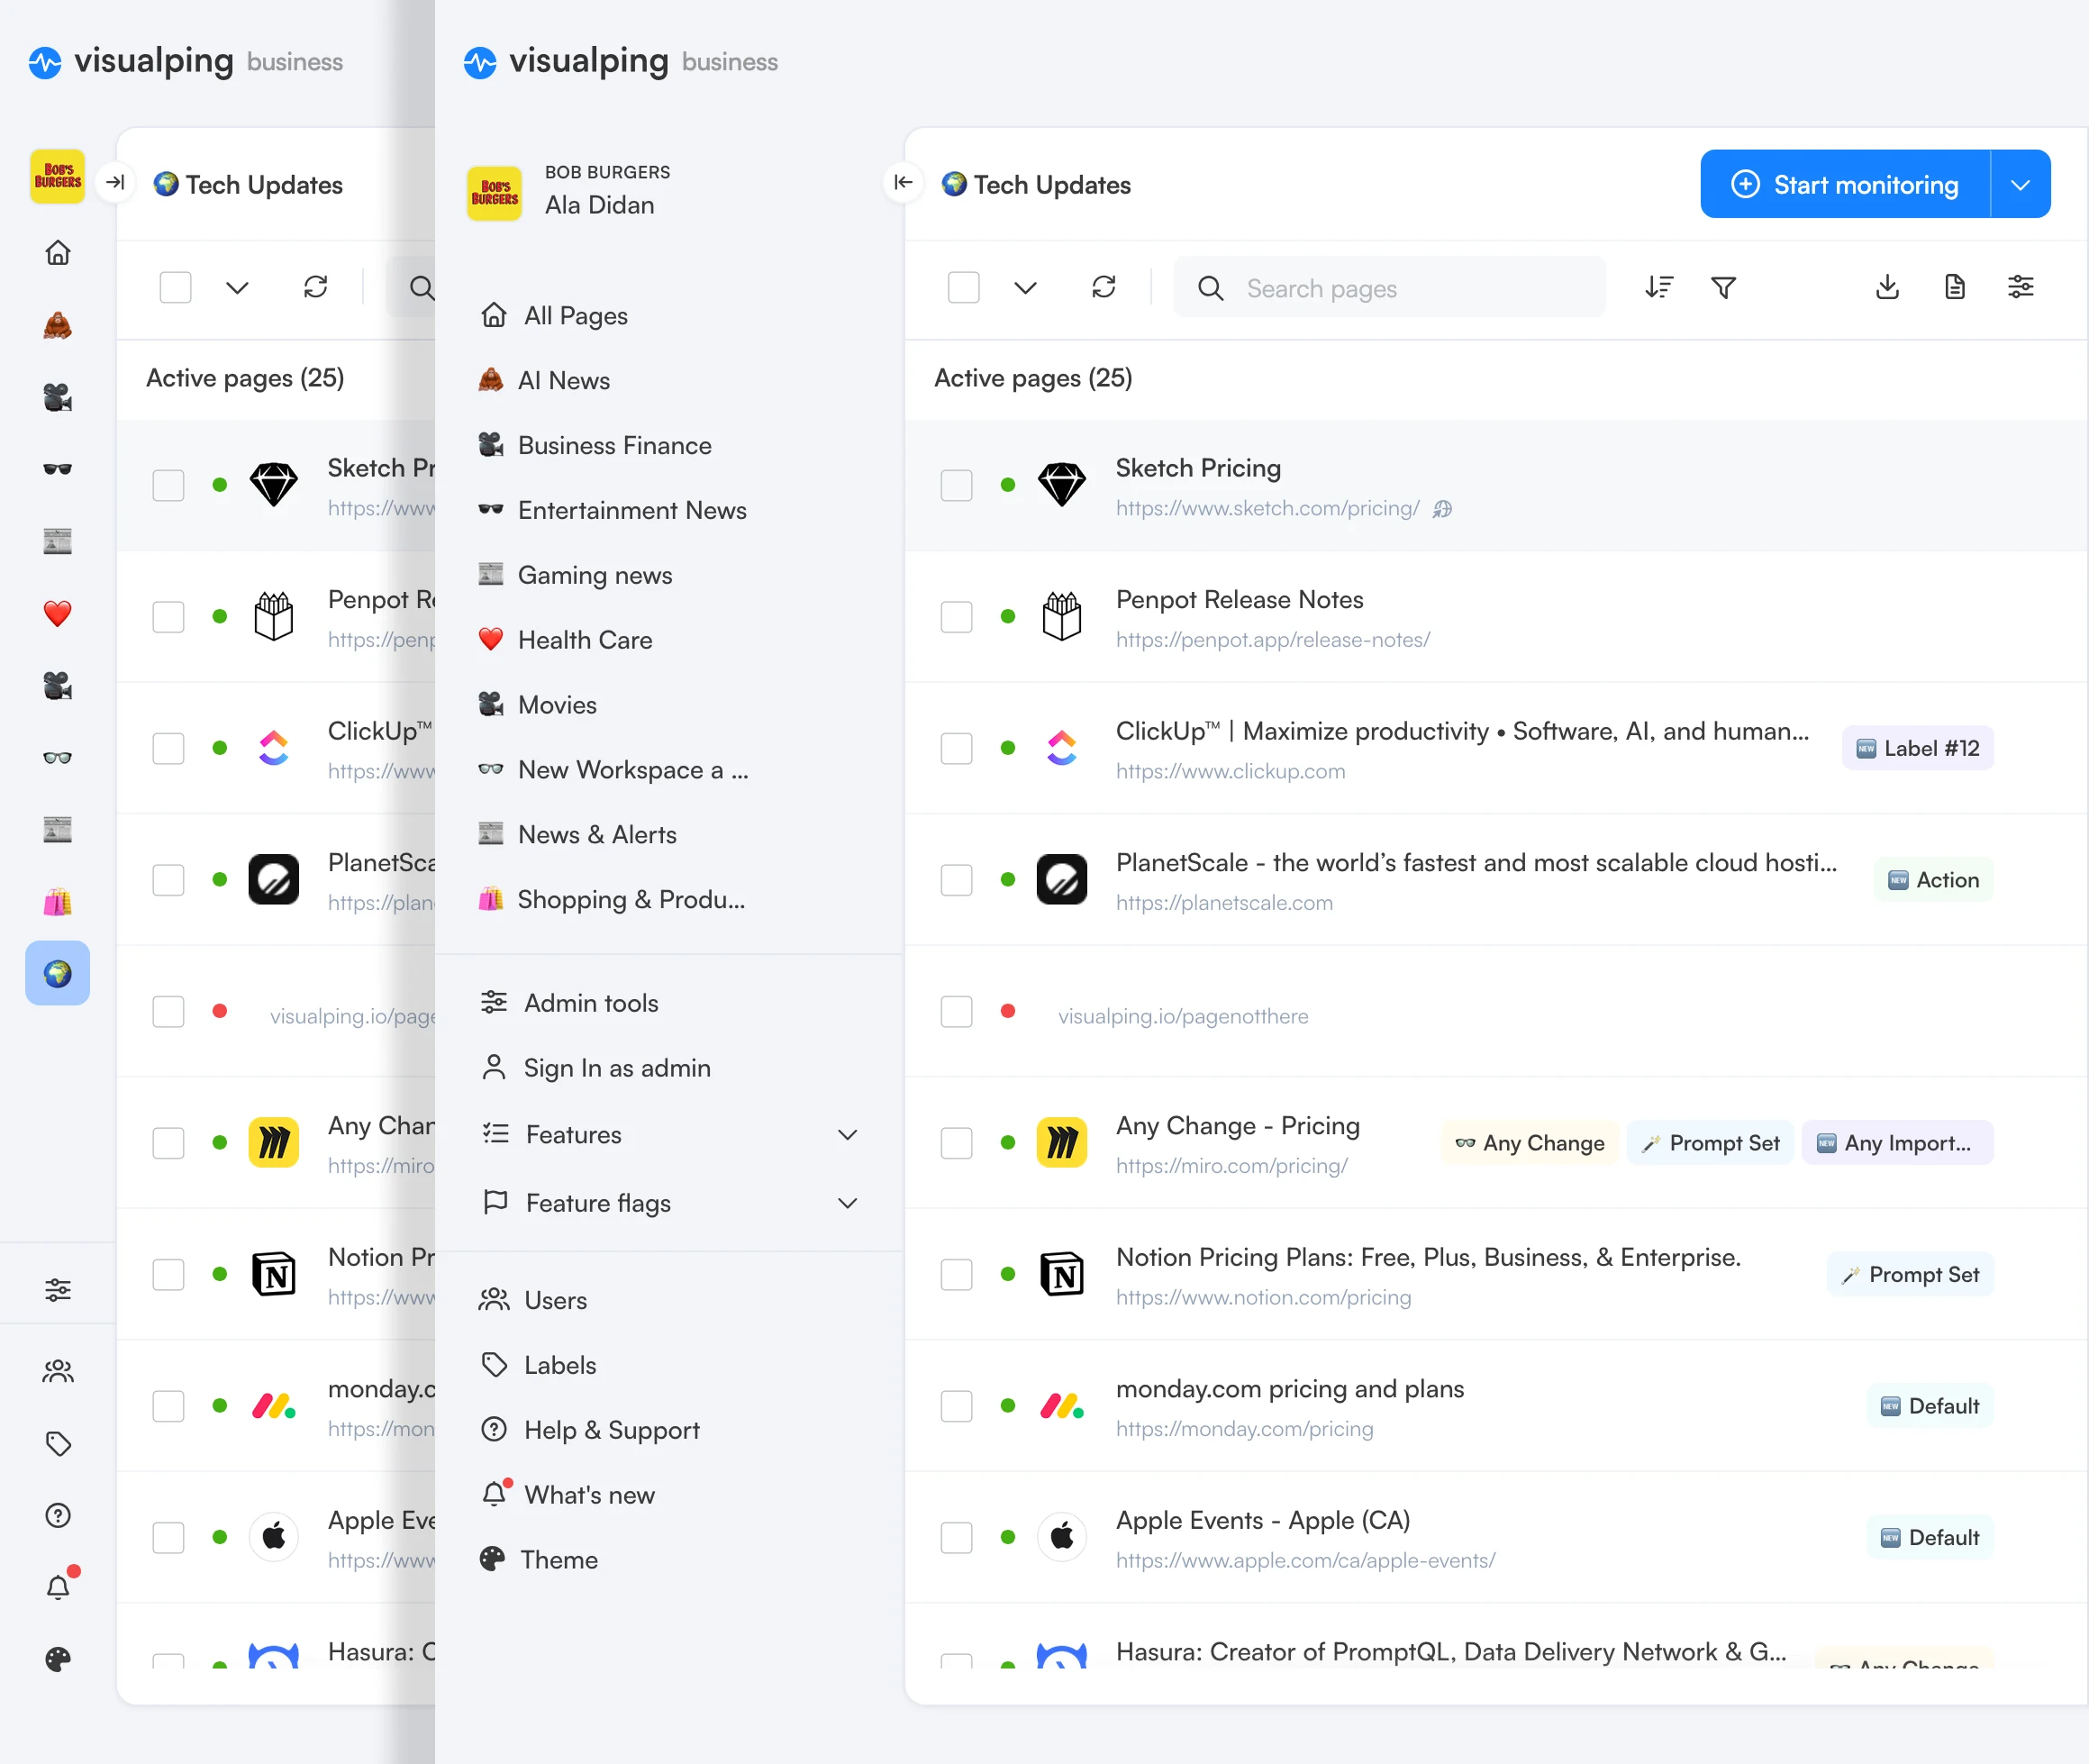
The previous sidebar demanded too much attention while making workspace navigation less straightforward than it needed to be. I wanted navigation to feel like a natural part of the experience, so I focused on simplifying workspace switching, bringing key destinations together, and establishing a quieter visual hierarchy across the sidebar and global header.
Page List
Managing more pages with less effort
For users managing multiple monitored pages, the dashboard needs to make information easy to scan and actions easy to find. I focused on balancing information density with clarity, giving users a better overview of their pages without introducing more complexity.
 ClickUp™ | Maximize productivity • Software, AI, and human…https://www.clickup.comAny Change
 Any Change - Pricinghttps://miro.com/pricing/Prompt Set
 AI Workflow Automation Platform & Tools - n8nhttps://n8n.ioImportant
 Slack Pricing Plans: Find the Right Fit for Your Team | Slackhttps://slack.com/pricingAction
A clearer path to everyday actions
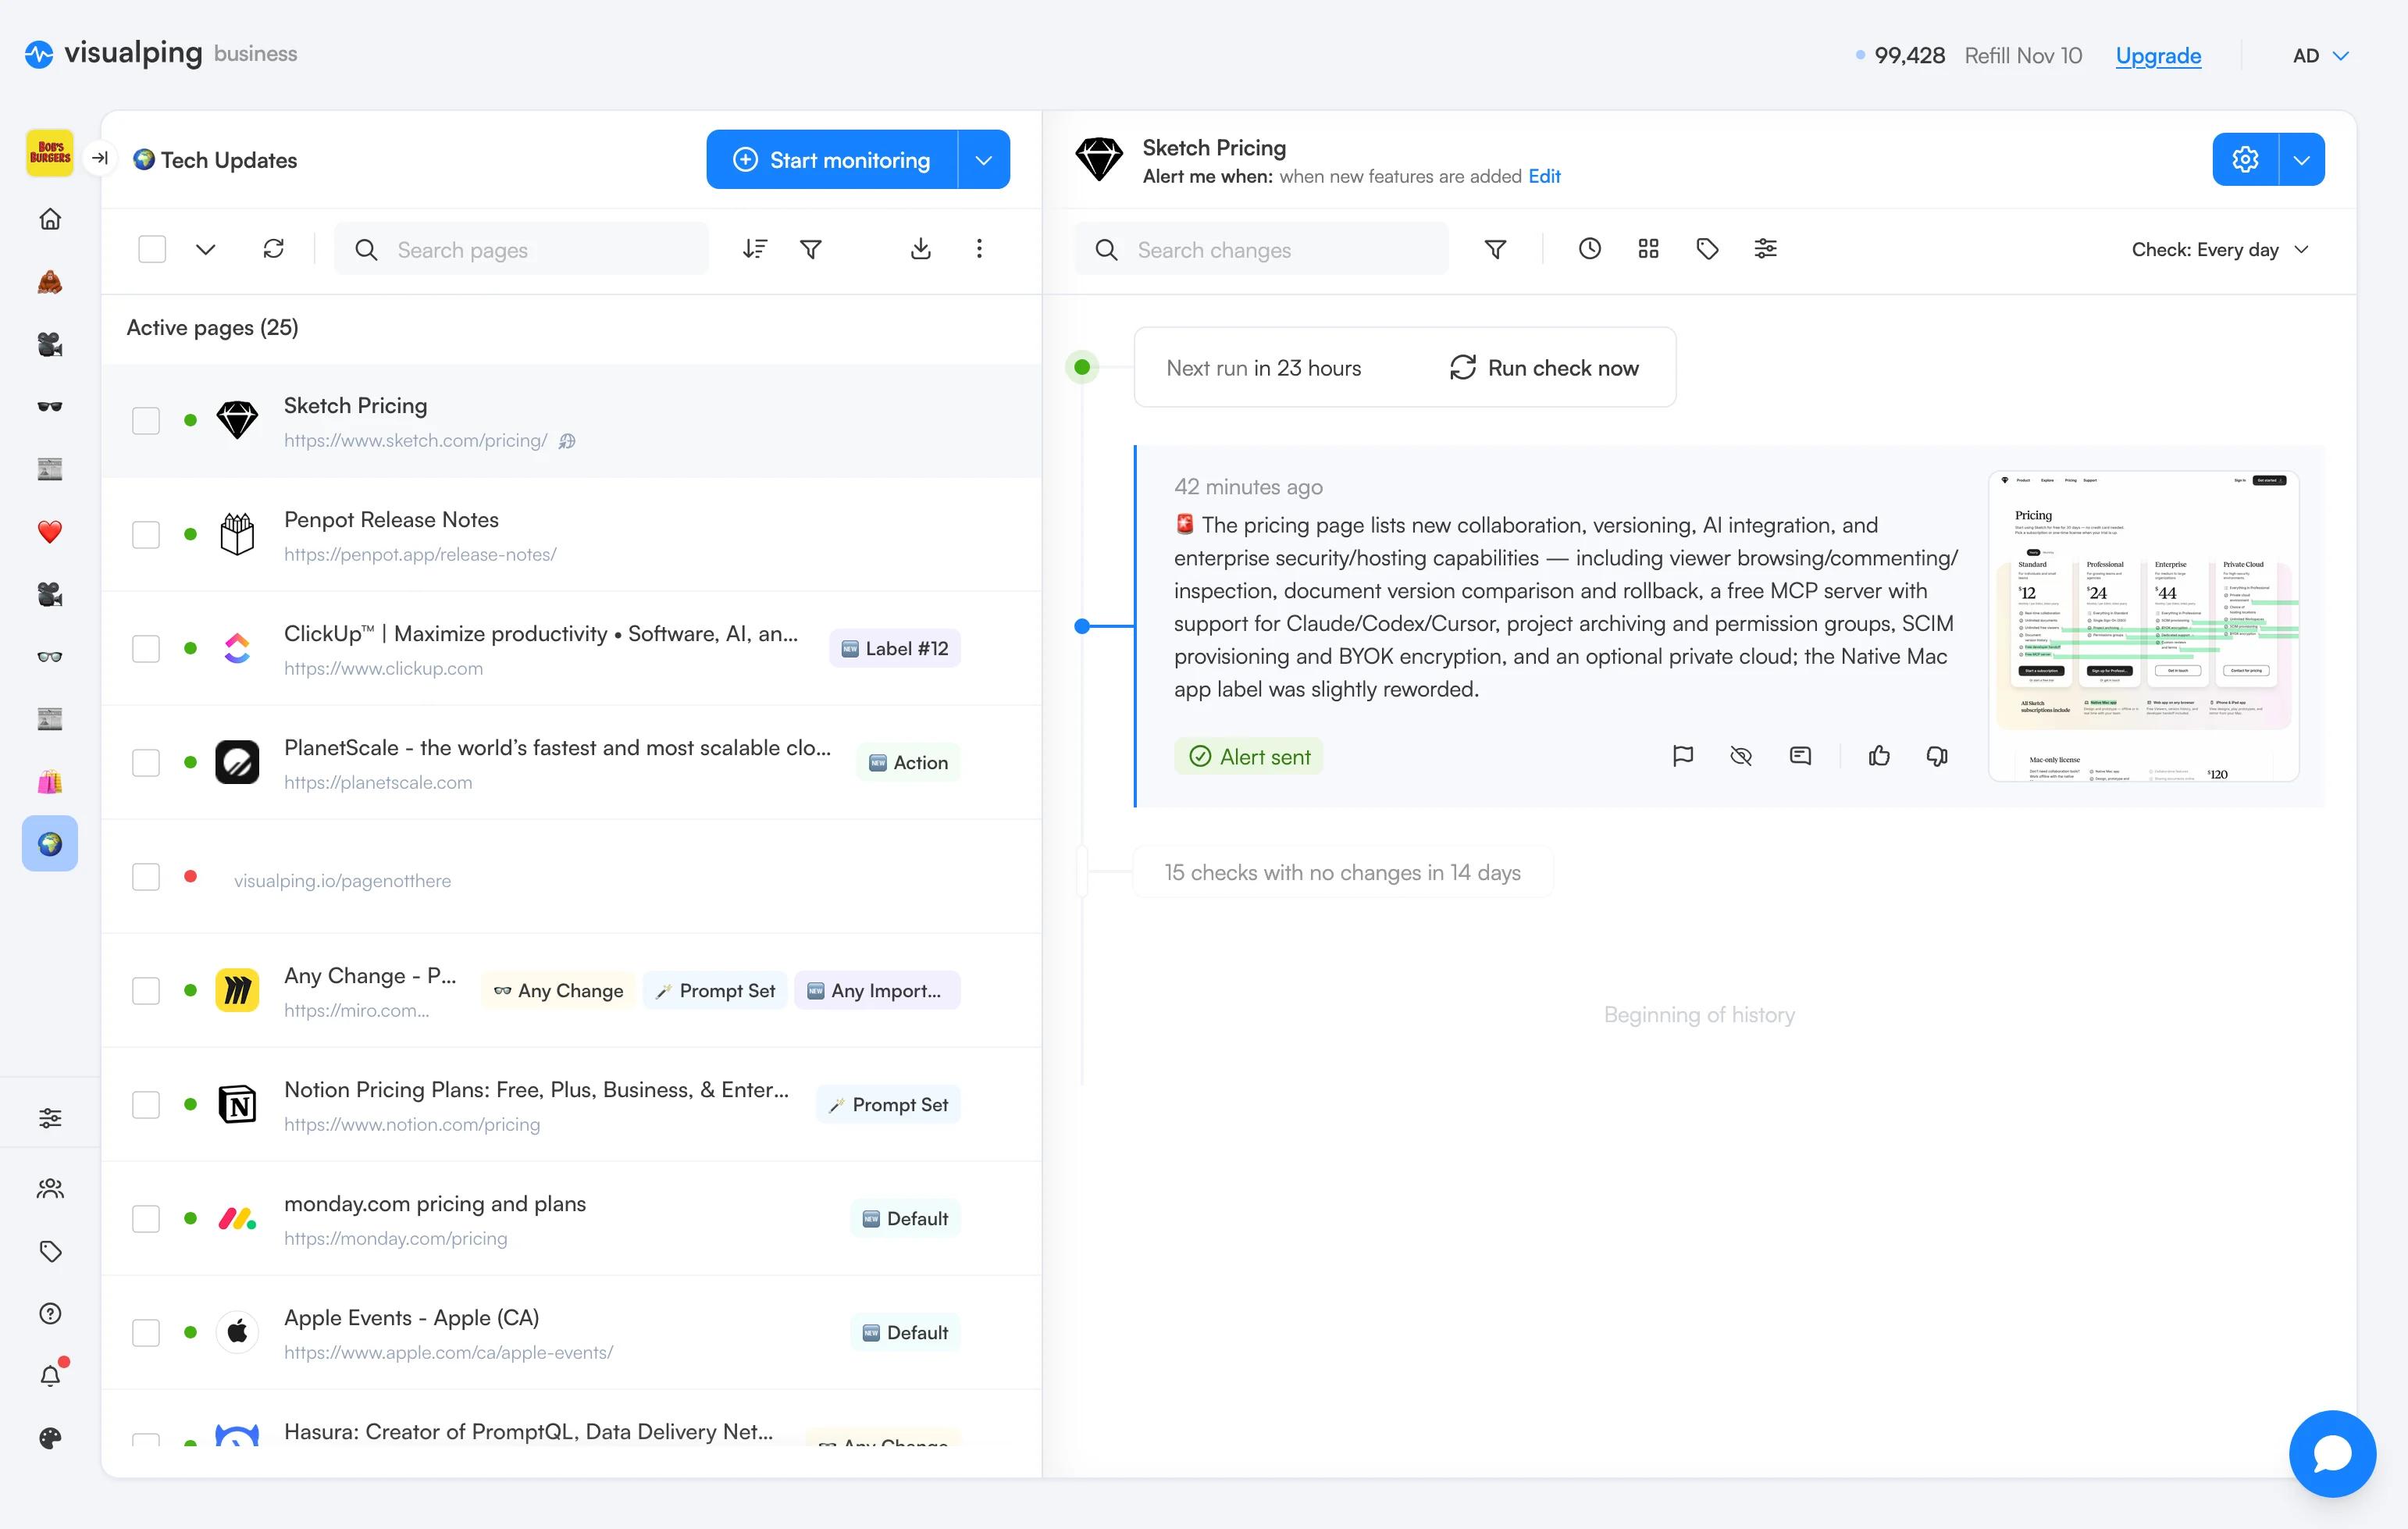
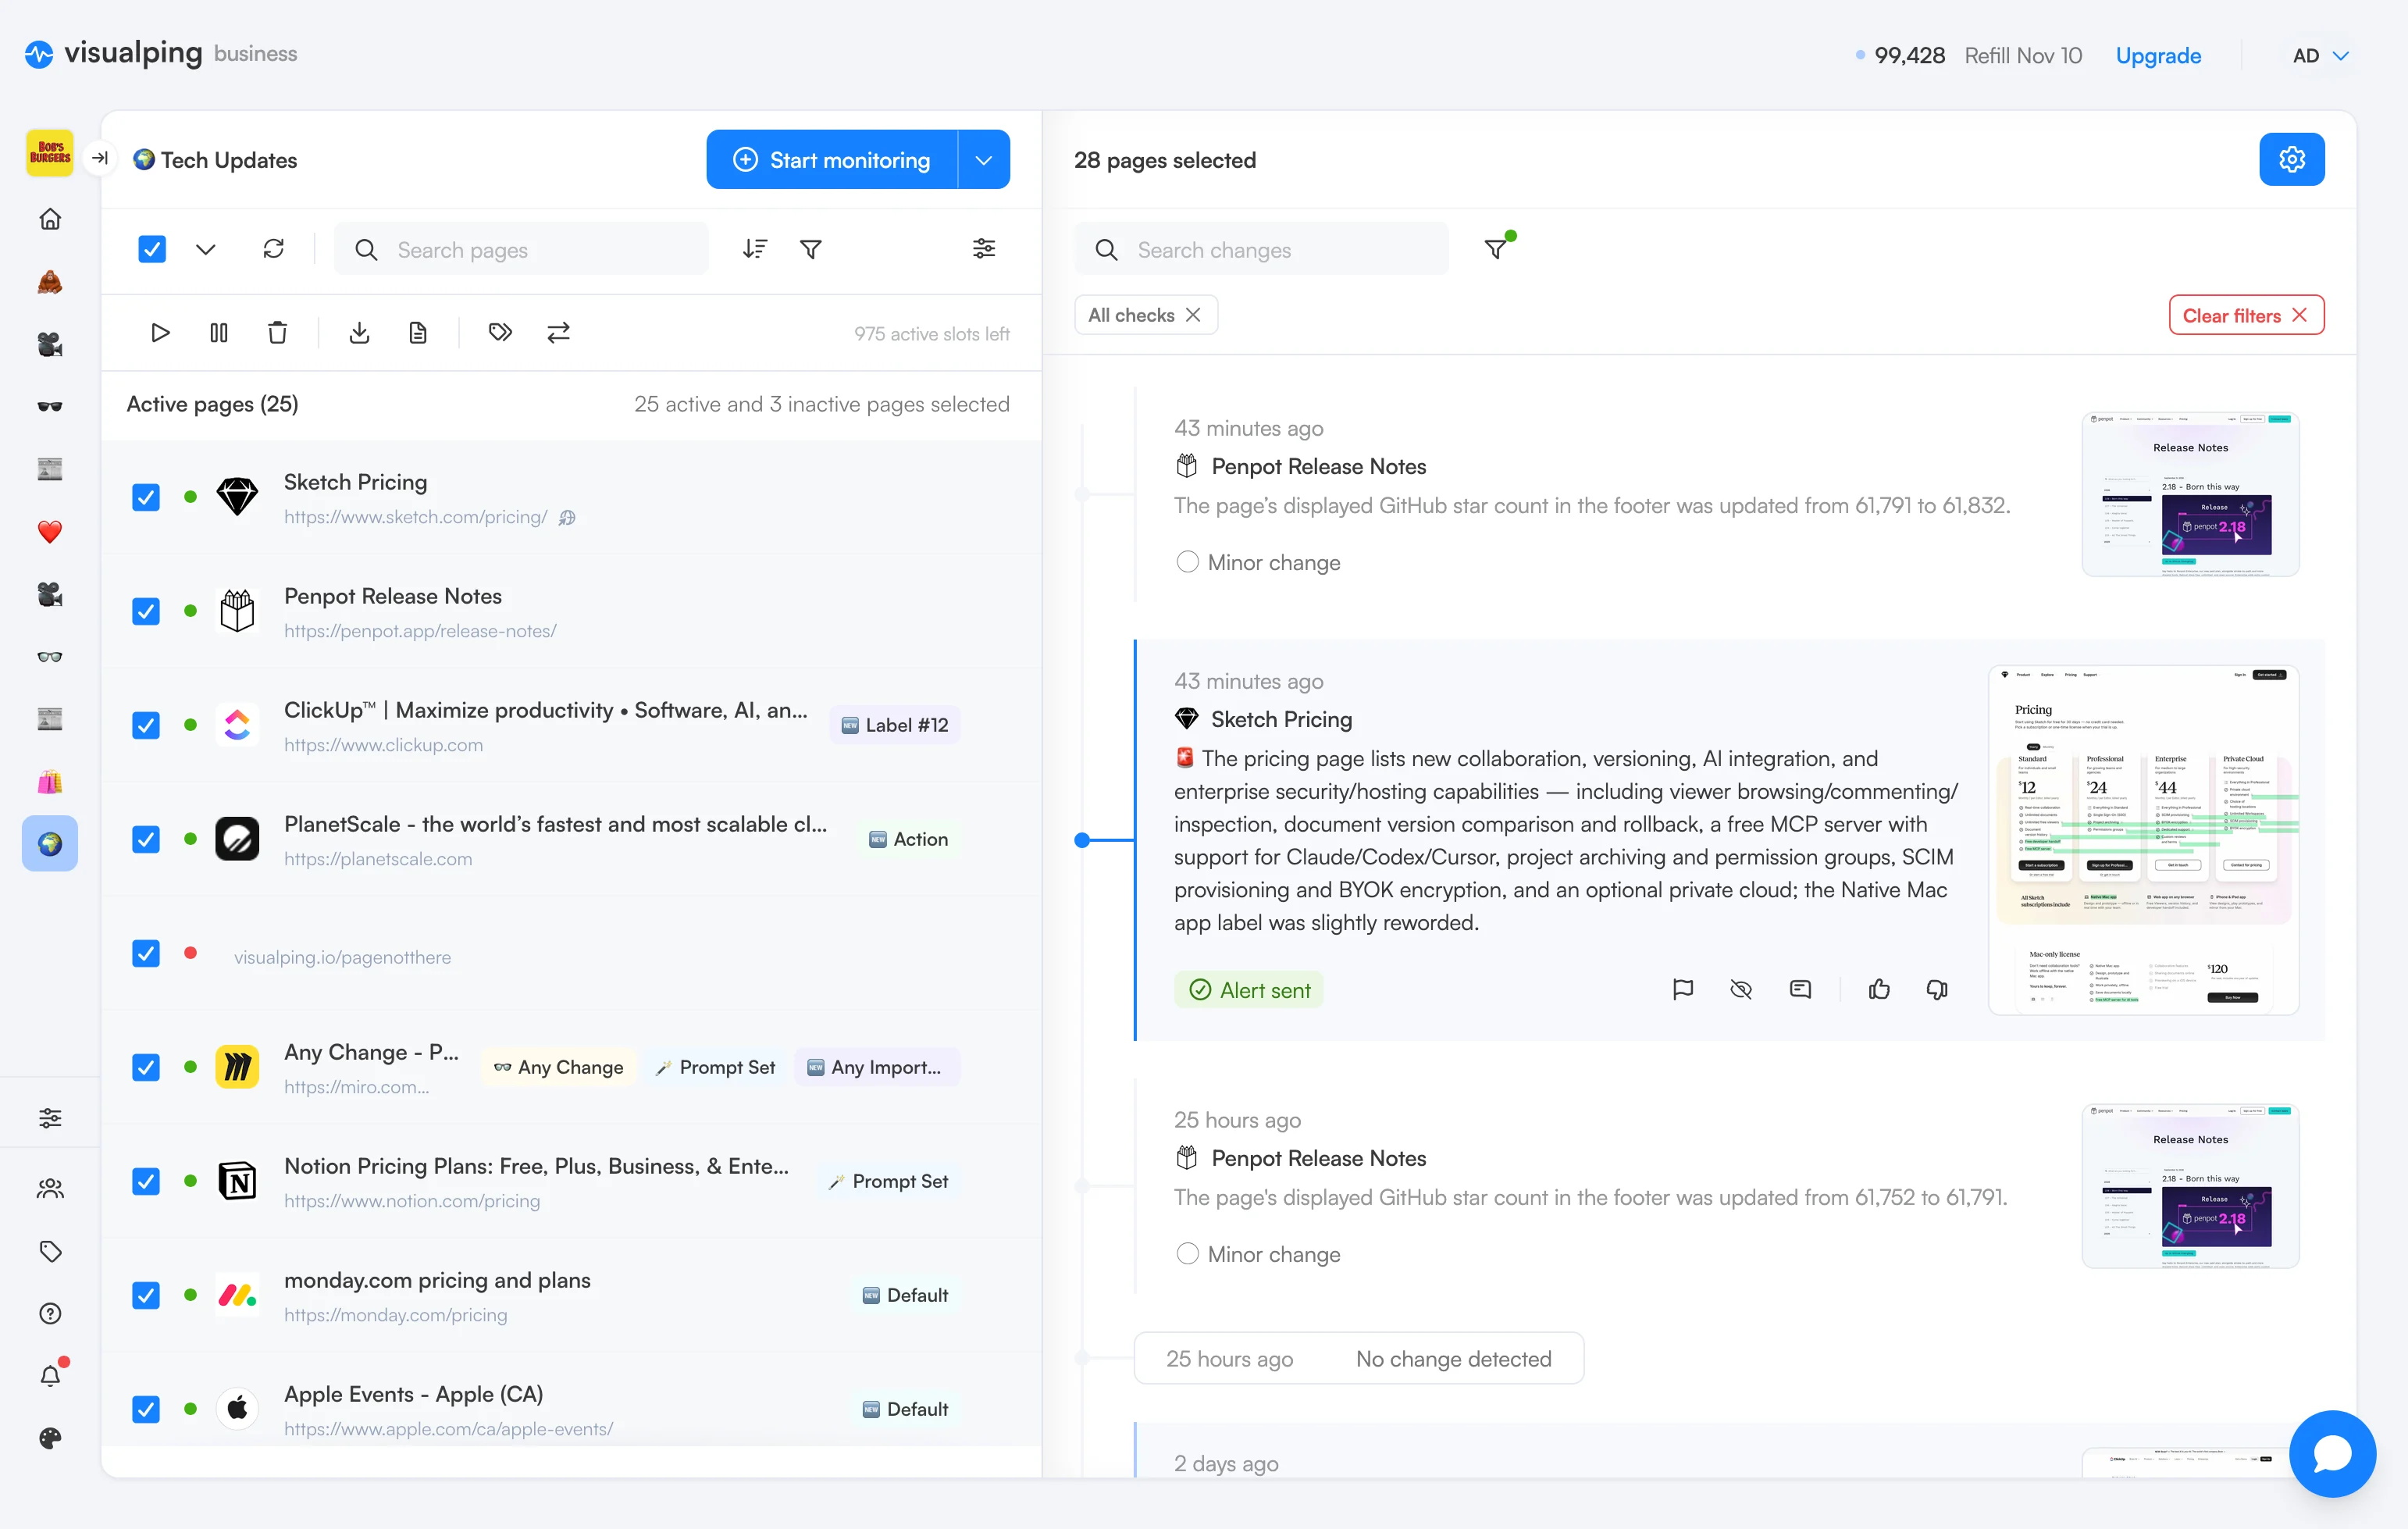
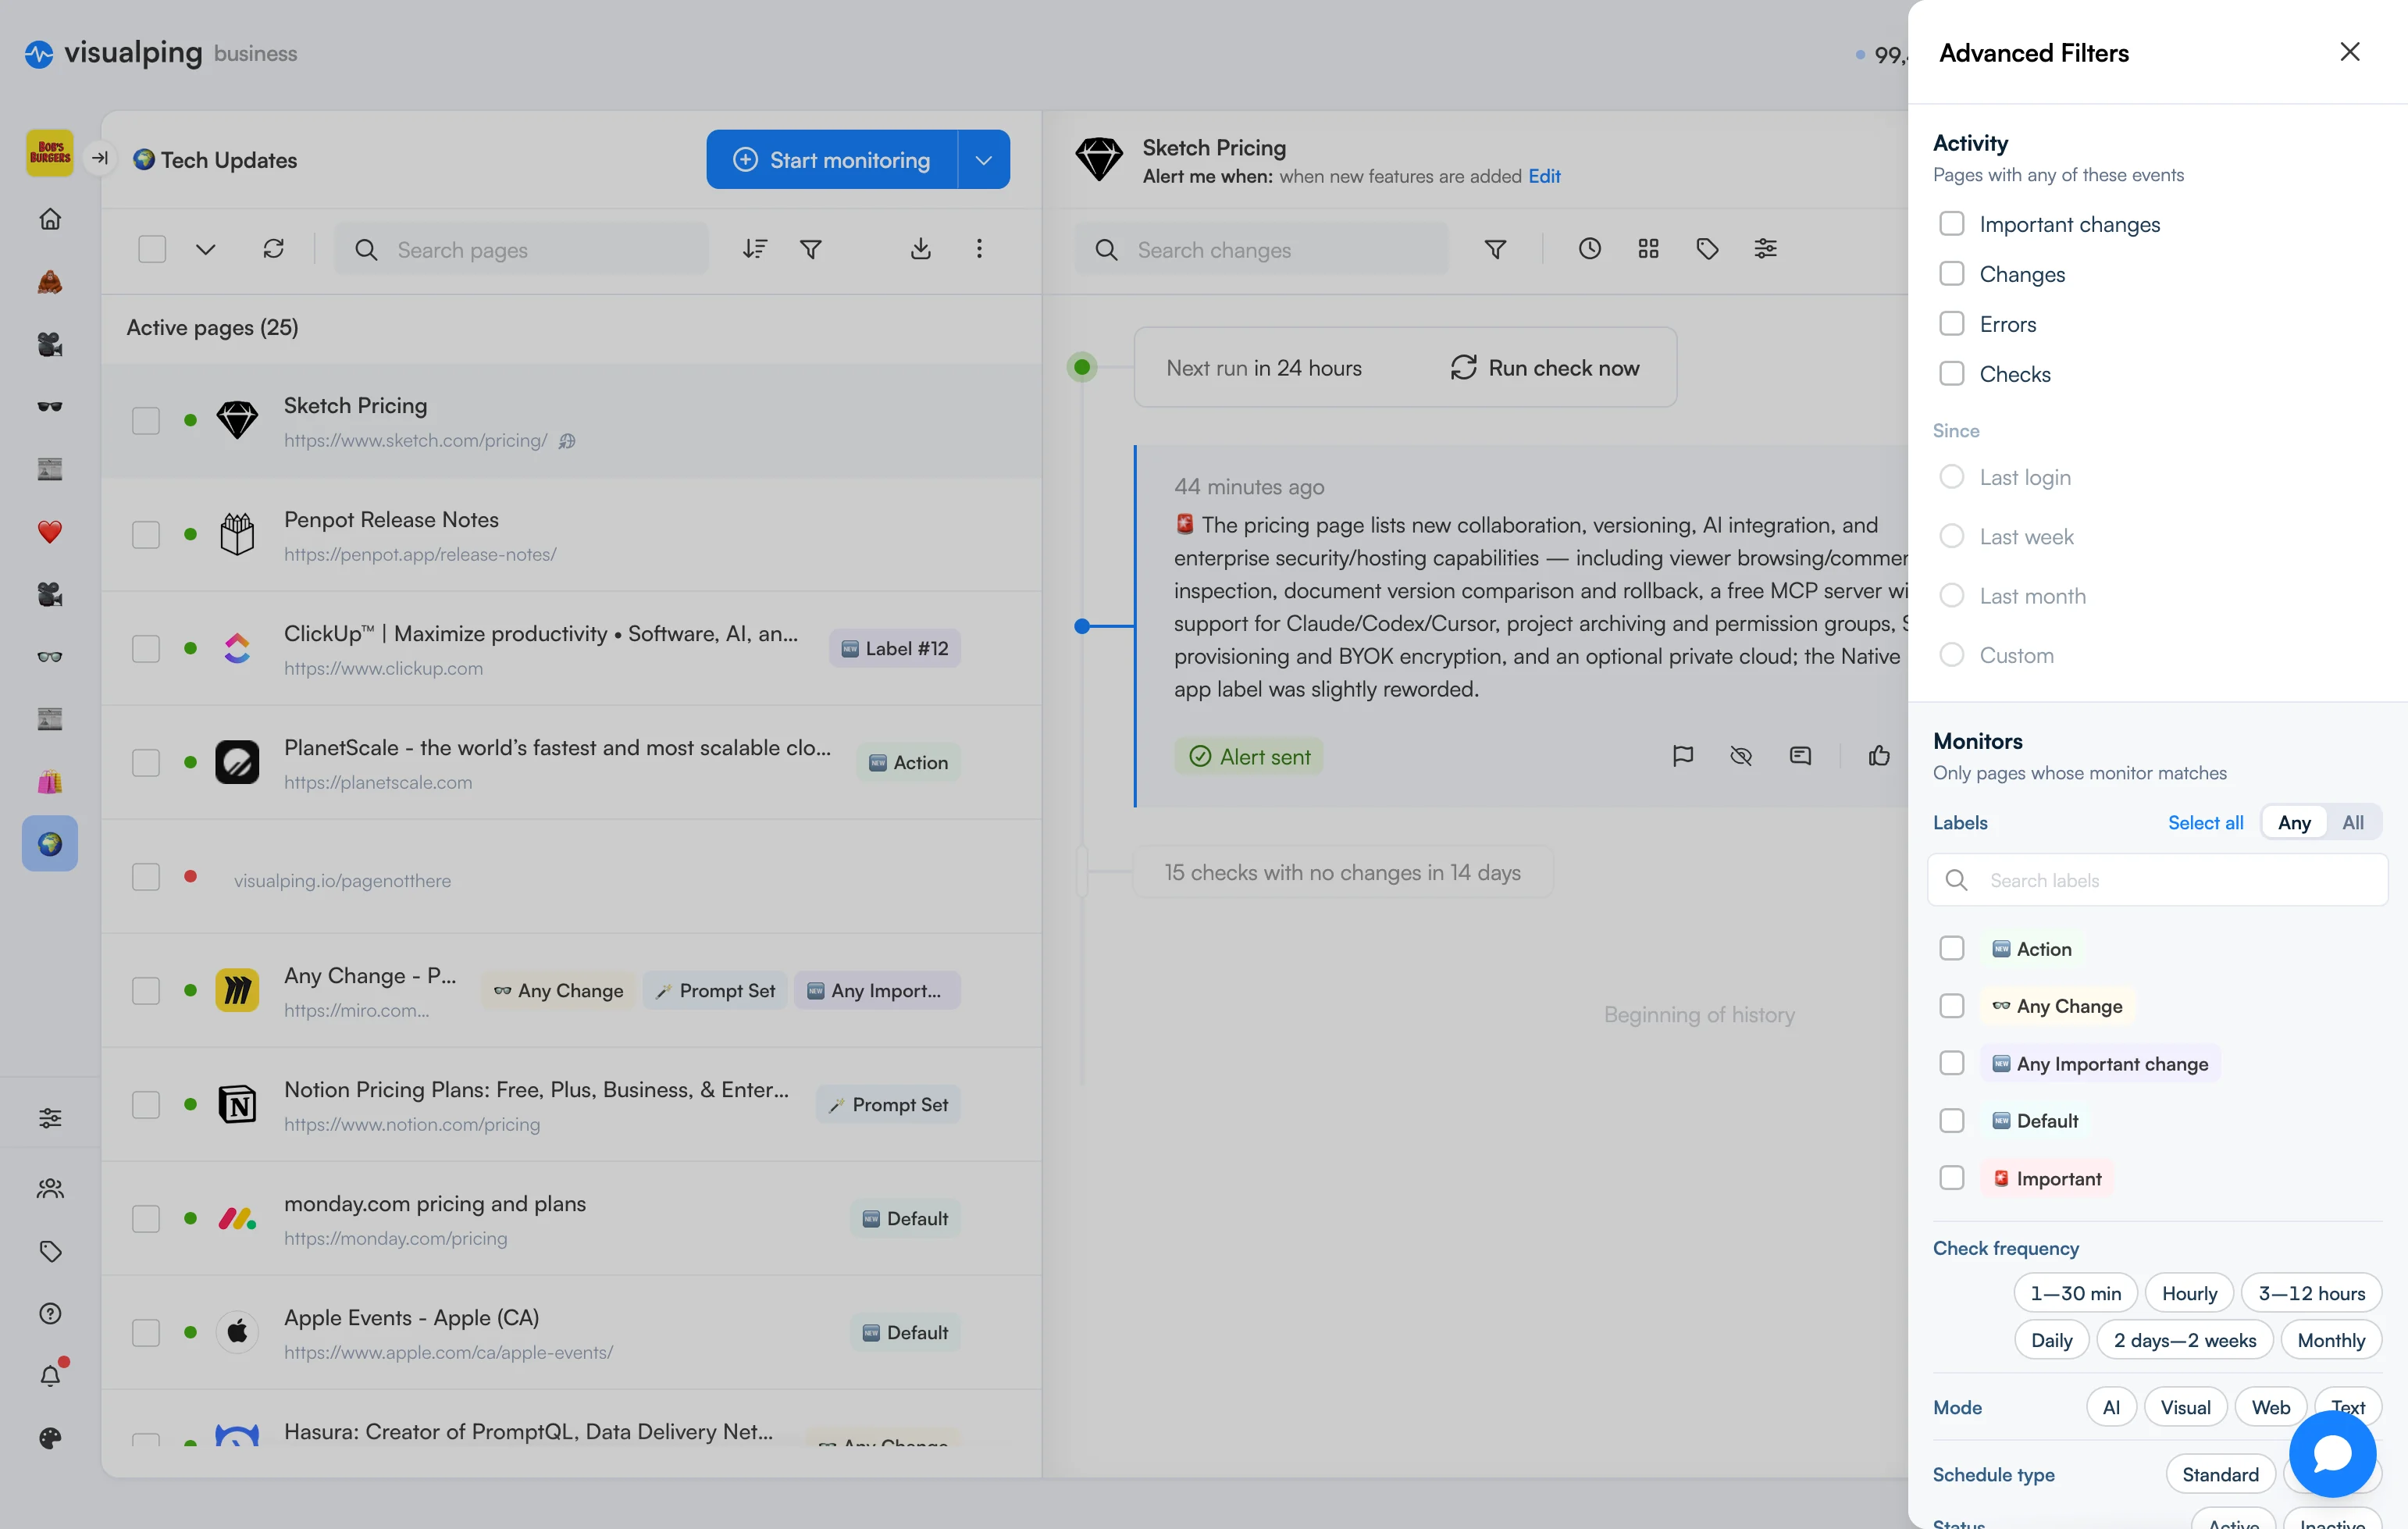
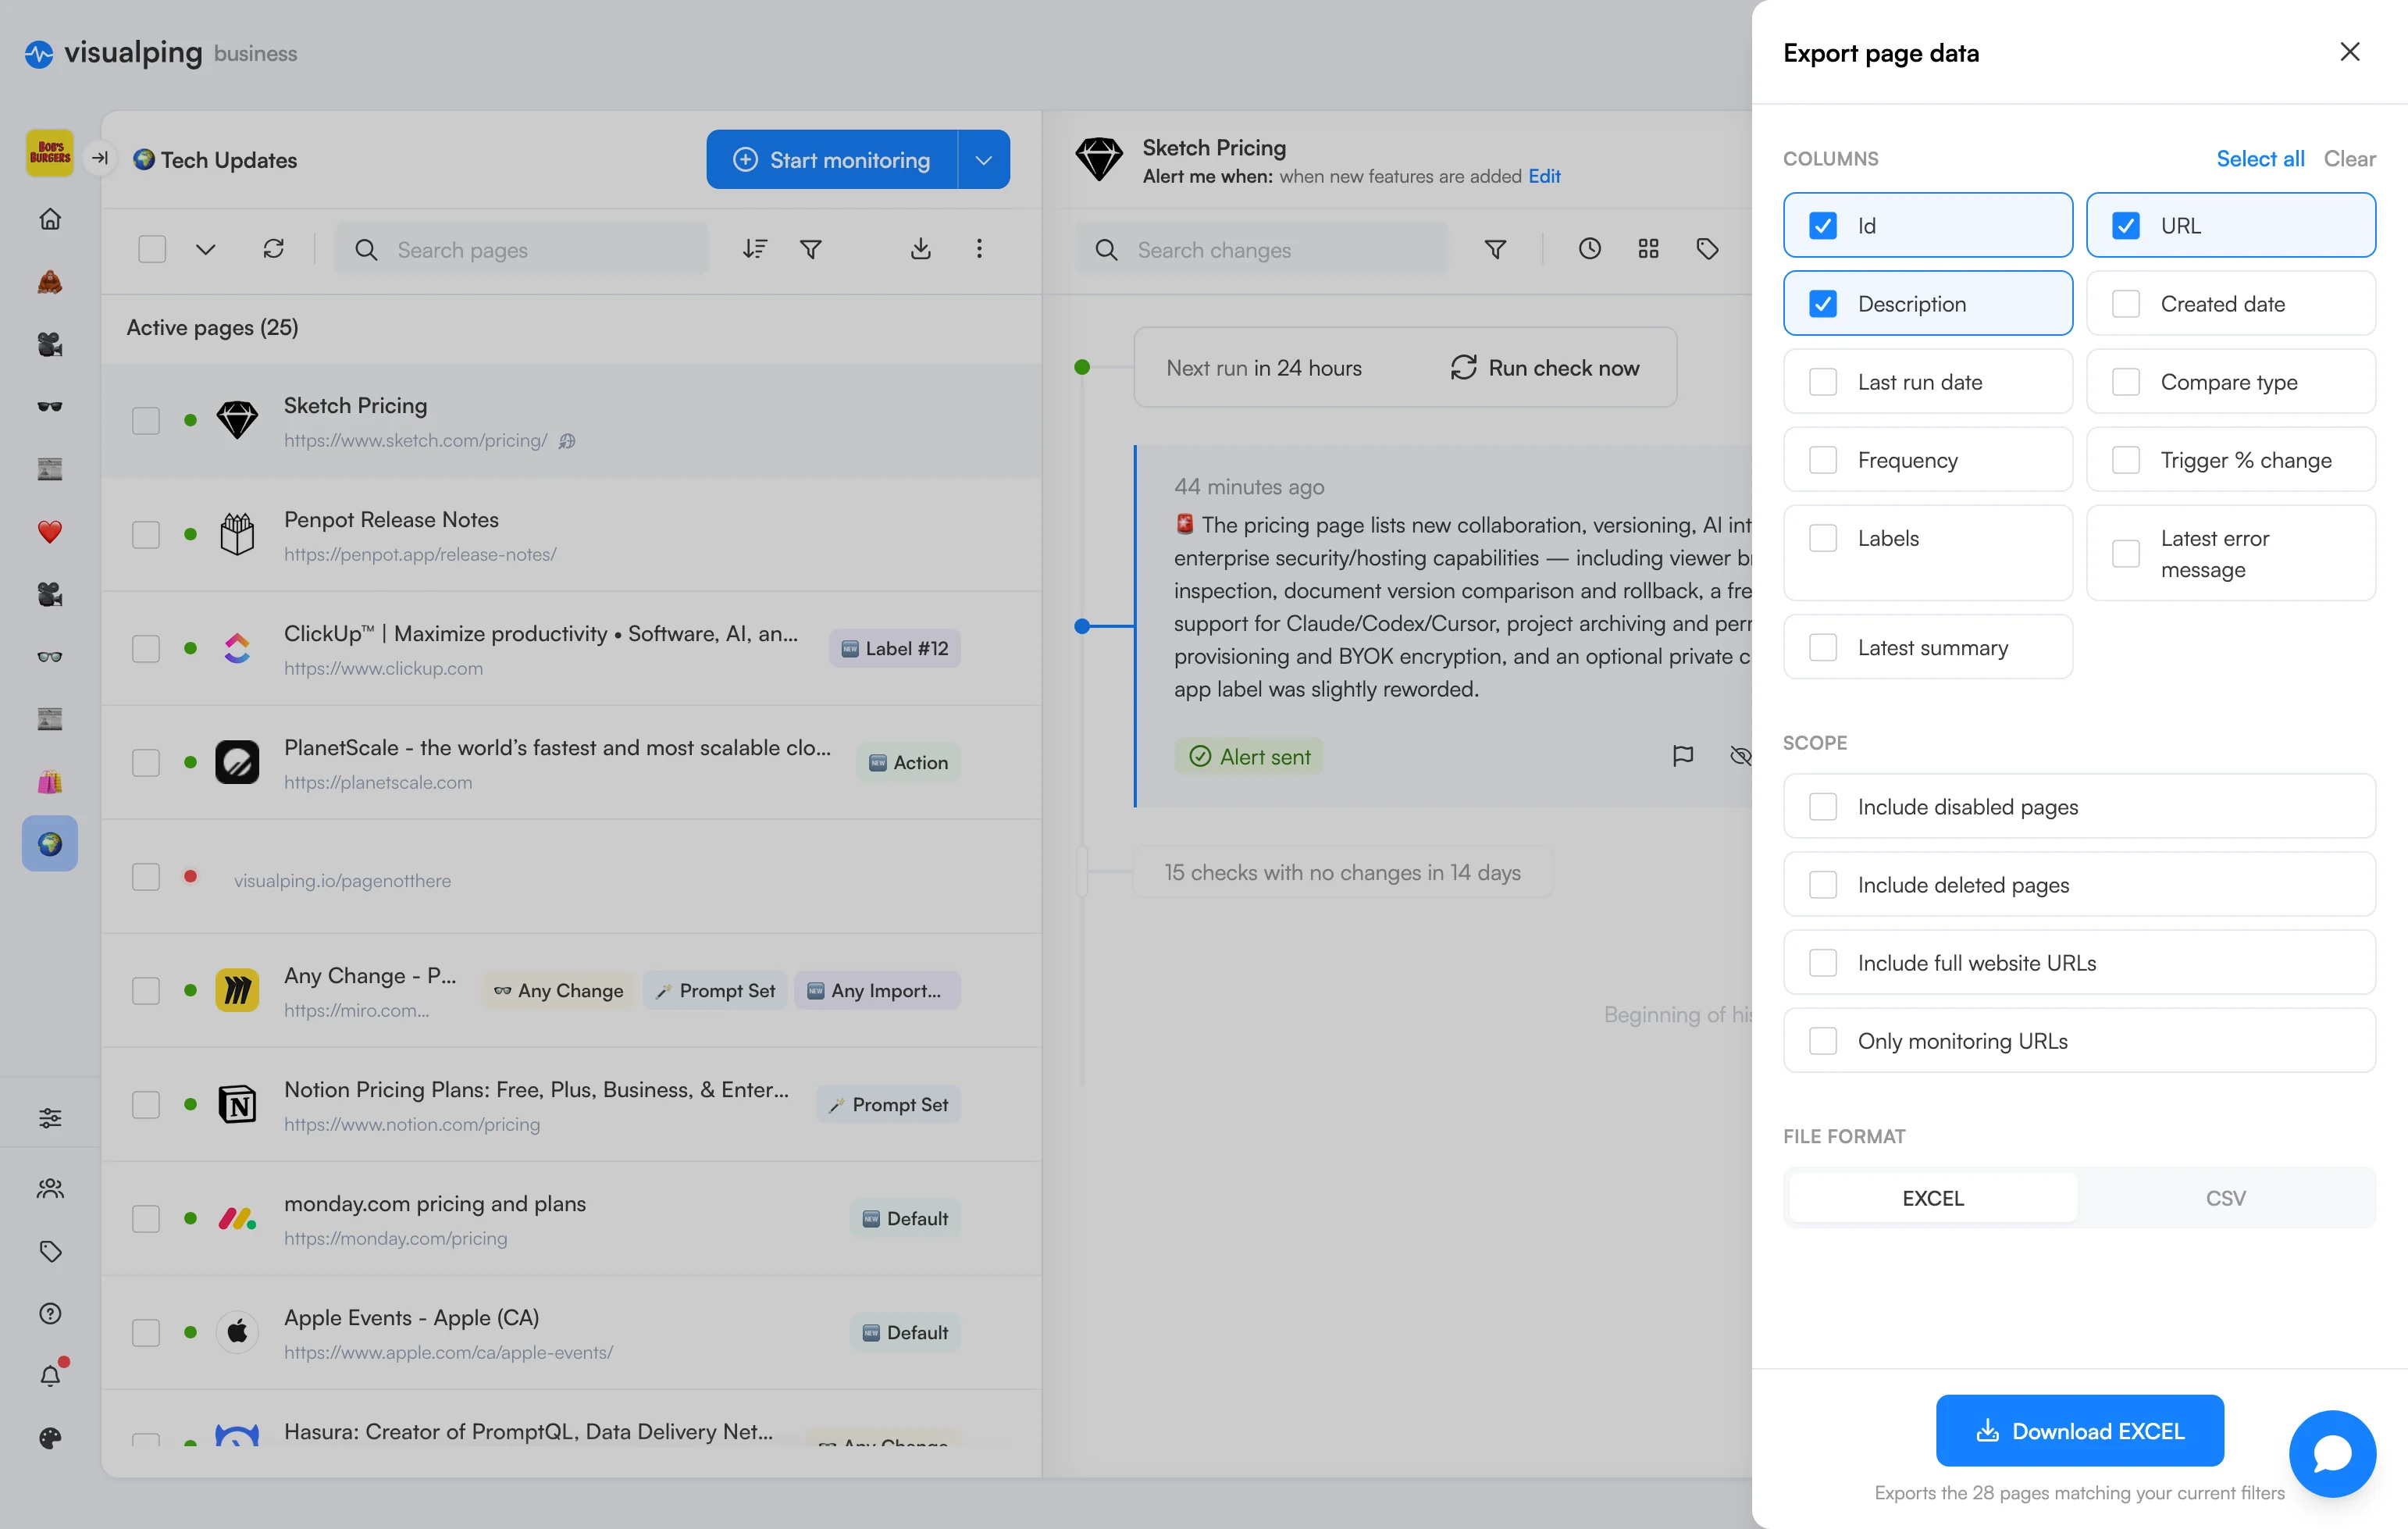
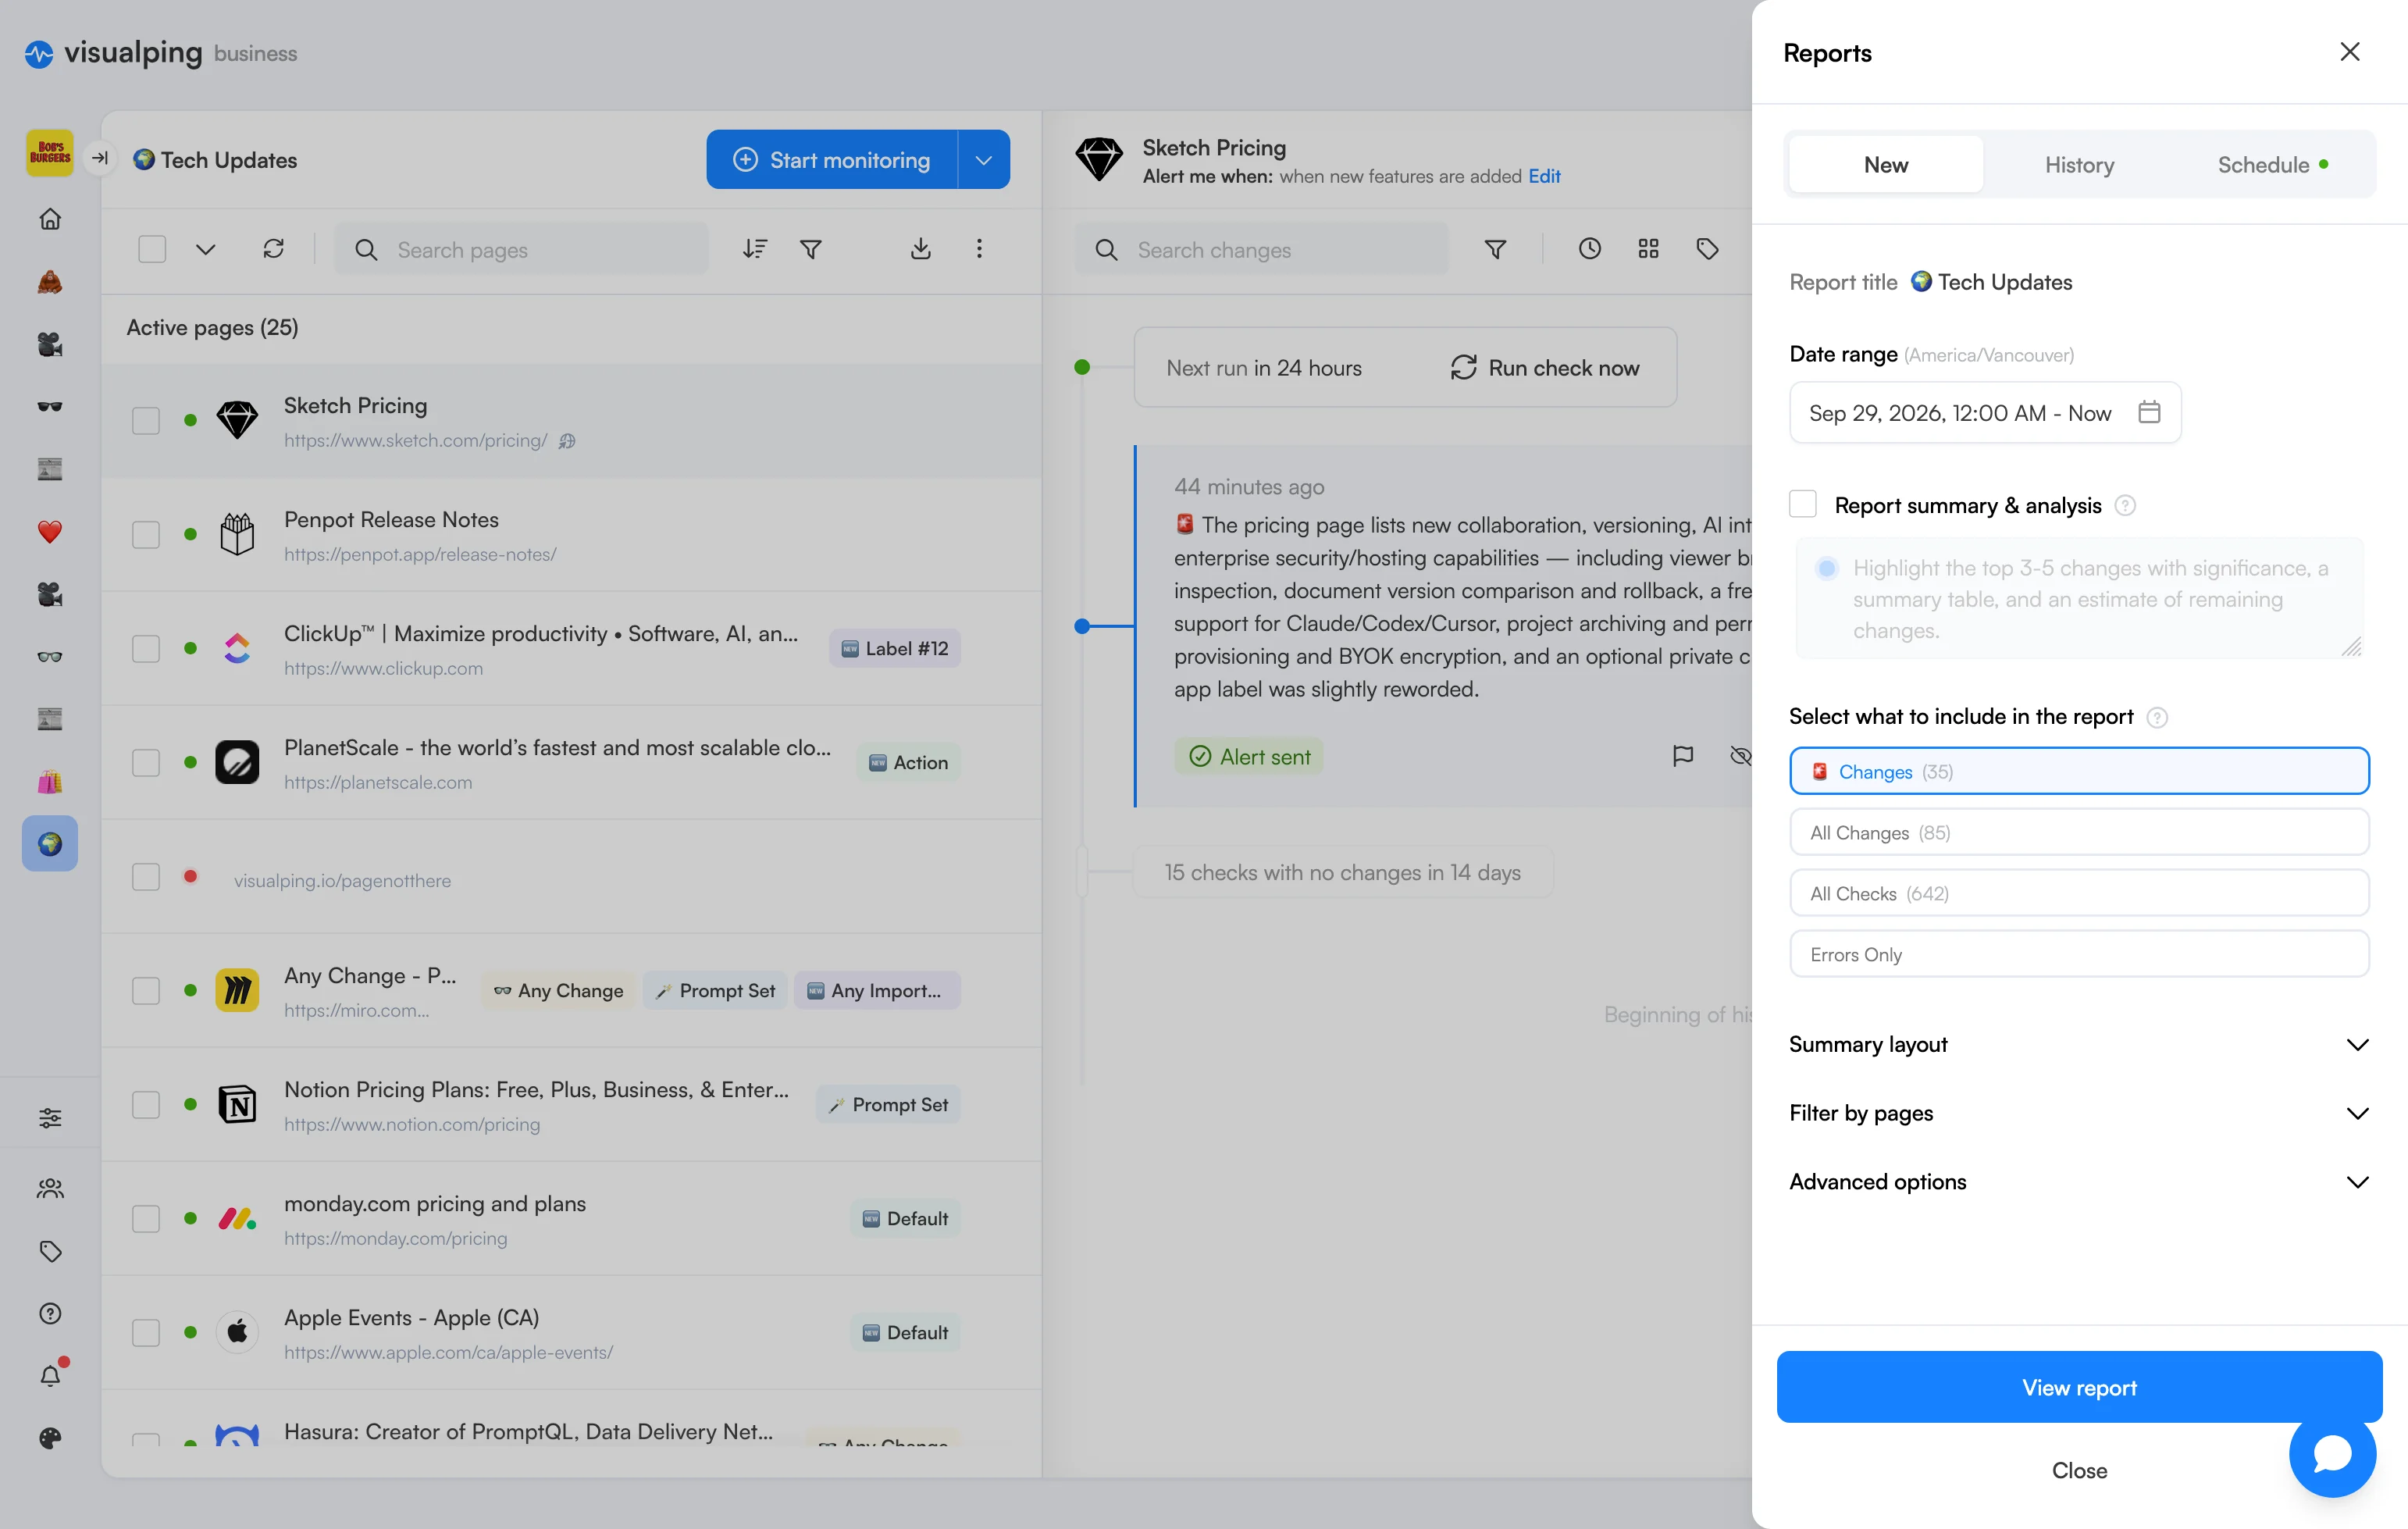
The old interface spread controls across toolbars and traditional modals, making routine tasks feel disconnected. I brought these interactions into a more consistent system, with clearer controls and contextual panels for editing, filtering, and bulk actions. This gives users a predictable way to manage their pages while keeping the dashboard in view.
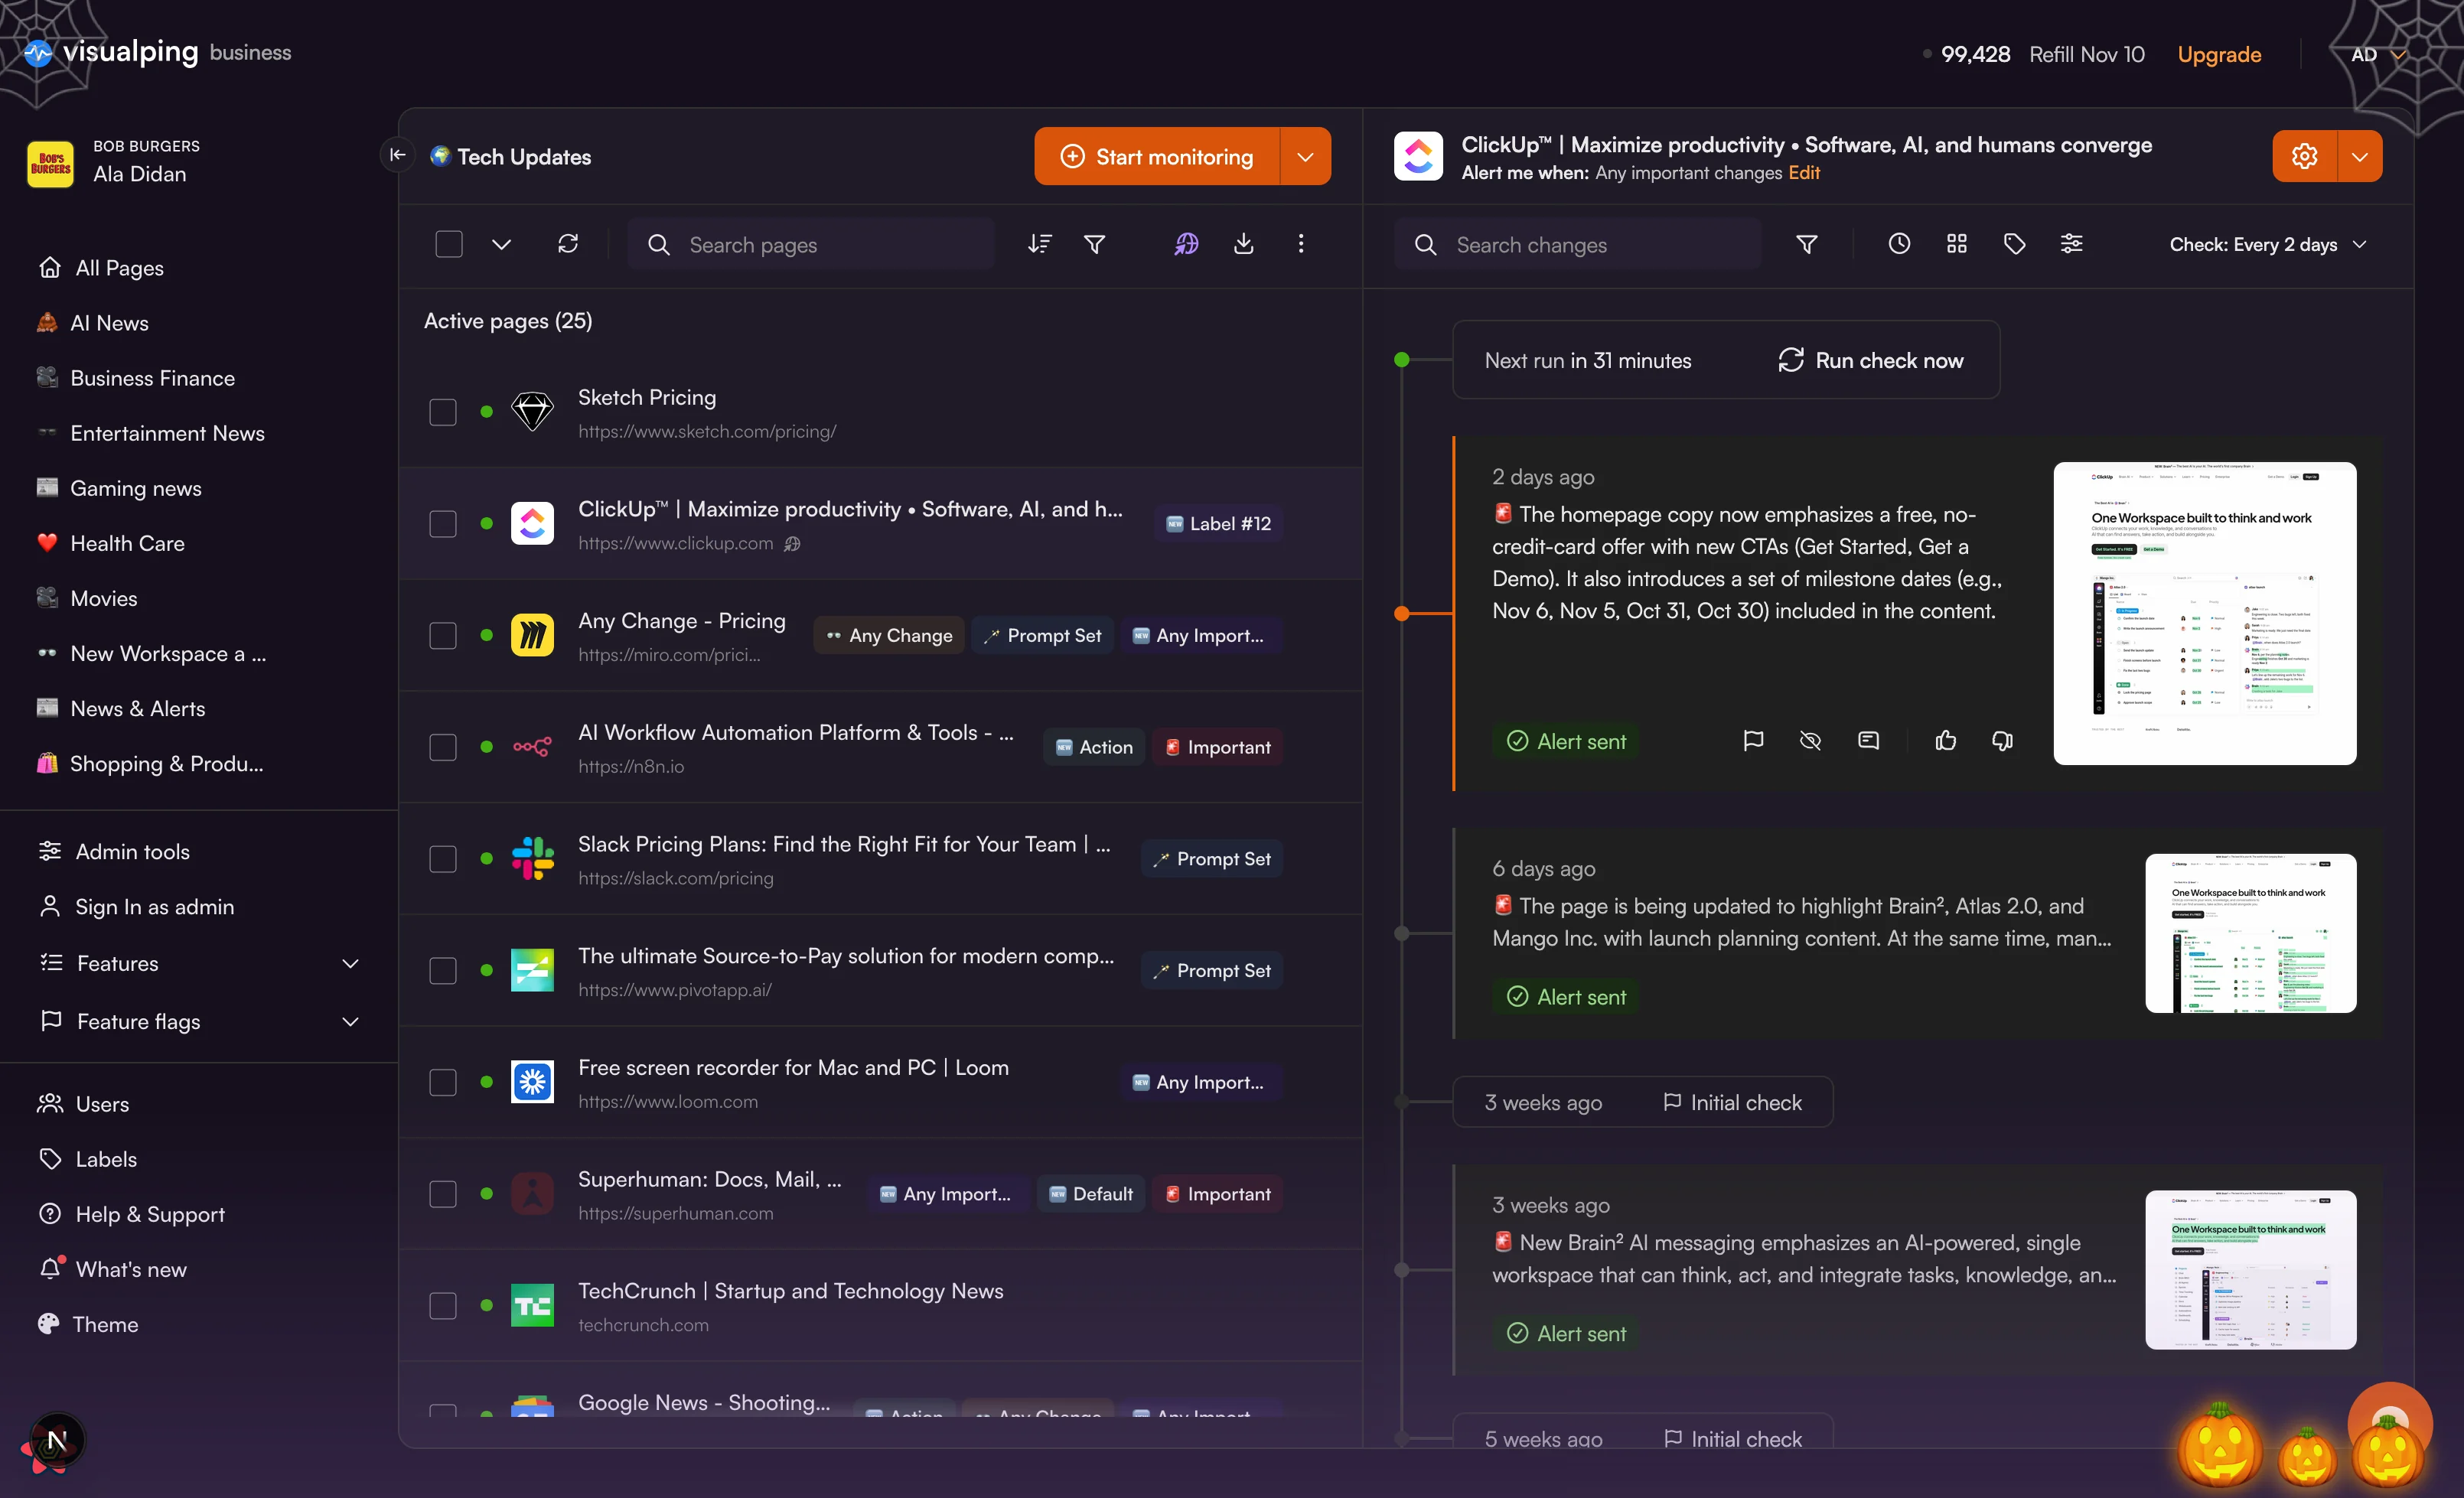
The page list and a page's history, side by side.
More information without more noise
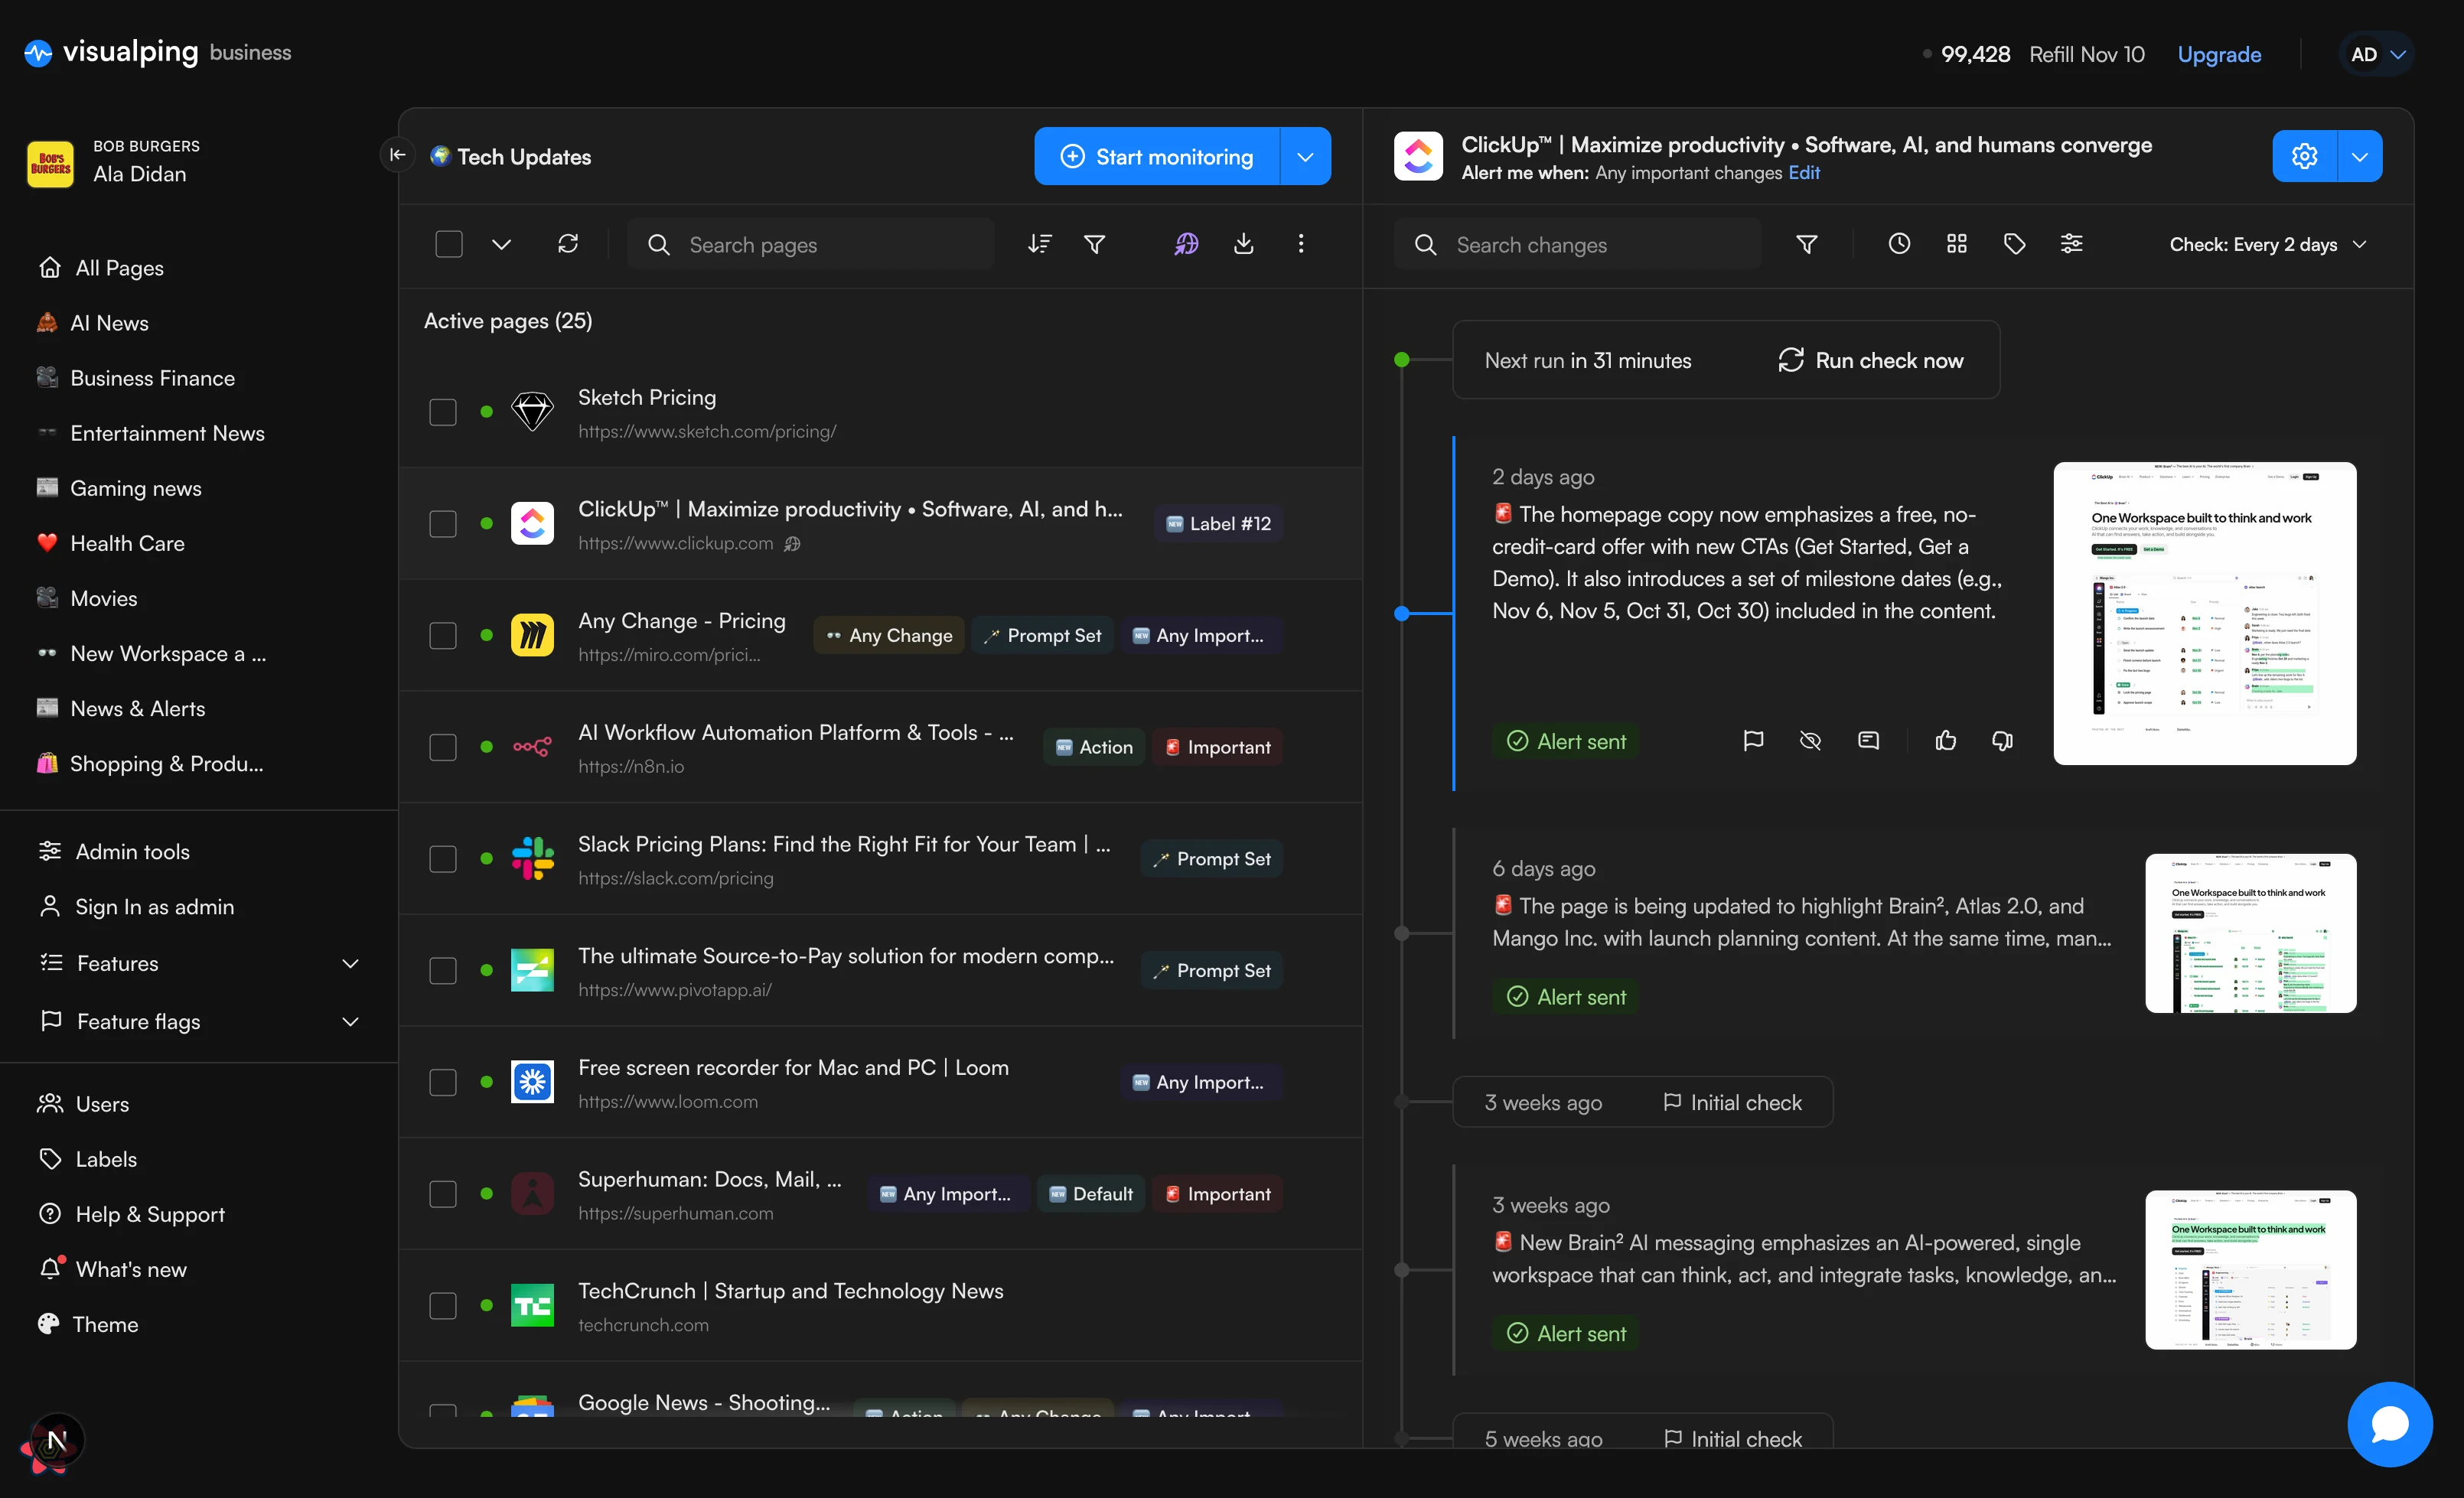
The page list needed to support users managing many monitors without becoming difficult to scan. I prioritized the information that helps people recognize and understand each page, while reducing unnecessary visual weight. The result is a more compact list with clearer page identities, labels, and statuses, making it easier to find what matters.
Active pages (24)
 Sketch Pricinghttps://www.sketch.com/pricing/
 Penpot Release Noteshttps://penpot.app/release-notes/
- ClickUp™ | Maximize productivity • Software, AI, and humans convergehttps://www.clickup.comDefault
 PlanetScale - the world’s fastest and most scalable cloud hostinghttps://planetscale.comAction
- Any Change - Pricinghttps://miro.com/pricing/Any Change
 Notion Pricing Plans: Free, Plus, Business, & Enterprise.https://www.notion.com/pricingPrompt Set
 monday.com pricing and planshttps://monday.com/pricingDefault
 Apple Events - Apple (CA)https://www.apple.com/ca/apple-events/Default
 Hasura: Creator of PromptQL, Data Delivery Network …https://hasura.ioAny Change
- AI Workflow Automation Platform & Tools - n8nhttps://n8n.ioImportant
- Slack Pricing Plans: Find the Right Fit for Your Team | Slackhttps://slack.com/pricingPrompt Set
 The AI search and retrieval platform - Agentic | Gen…https://www.algolia.comAny Import…
 The ultimate Source-to-Pay solution for modern companieshttps://www.pivotapp.ai/Prompt Set
 Free screen recorder for Mac and PC | Loomhttps://www.loom.comAny Import…
 Superhuman: Docs, Mail, …https://superhuman.comImportant
 The AI workspace that works for you. | Notionhttps://www.notion.soAny Import…
 TechCrunch | Startup and Technology Newstechcrunch.com
 Google News - Shooting…https://news.google.com/st…Action
 Framer Pricinghttps://www.framer.com/pricing
Monitoring Timeline
From individual changes to a complete history
Monitoring isn’t just about knowing when something changes. Users also need to understand what happened between those changes and whether their monitors are working as expected. I moved away from a changes-only view toward a unified timeline that brings checks, changes, and errors together, giving users a more complete picture of each monitored page.
ClickUp™ | Maximize productivity • Software, AI, and humans converge
Alert me when: Any important changes Edit
Making monitoring activity easier to follow
A list of events can tell users what happened, but it doesn’t always help them understand the sequence. I chose a timeline approach to connect monitoring activity into a continuous history. Changes, checks, and errors now share a consistent structure, helping users follow what happened to a page over time.
ClickUp™ | Maximize productivity • Software, AI, and humans converge
Alert me when: Any important changes Edit
- Next run in 31 minutesRun check now
2 days ago
The homepage copy now emphasizes a free, no-credit-card offer with new CTAs (Get Started, Get a Demo). It also introduces a set of milestone dates (e.g., Nov 6, Nov 5, Oct 31, Oct 30) included in the content.
Alert sent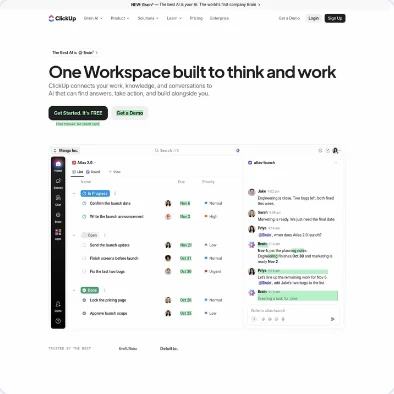
6 days ago
The page is being updated to highlight Brain², Atlas 2.0, and Mango Inc. with launch planning content. At the same…
Alert sent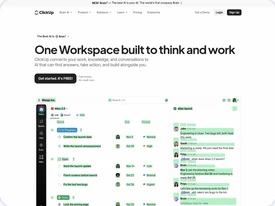
- 3 weeks agoInitial check
3 weeks ago
New Brain² AI messaging emphasizes an AI-powered, single workspace that can think, act, and integrate tasks,…
Alert sent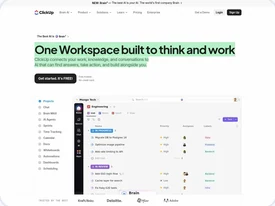
- 5 weeks agoInitial check
5 weeks ago
The homepage content is expanding to showcase Brain² AI capabilities and related product updates, with backend…
Alert sent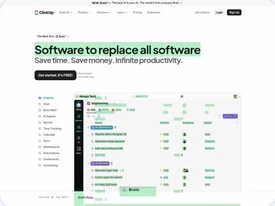
- 7 weeks agoInternal Error
- 2 months agoInitial check
2 months ago
Brand messaging updates introduce Brain AI and frame ClickUp as The Productivity Company, including the new…
Alert sent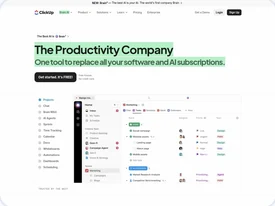
- 2 months agoInitial check
2 months ago
Brand messaging on the homepage is being reoriented around Brain² and Brain Intelligence, inserting new lines lik…
Alert sent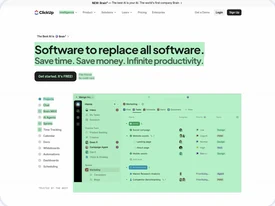
Appearance & Personalization
One dashboard, different ways to make it yours
The redesign supports light and dark modes, alongside a customizable appearance that lets users add a personal touch. Each mode maintains the same navigation, interactions, and information hierarchy, keeping the experience familiar regardless of how users choose to view it.
Bringing It All Together
One clearer experience
The redesign wasn’t about simplifying individual screens in isolation. I wanted the dashboard to feel like one connected experience, where navigation, page management, and monitoring history work together. By establishing clearer priorities and more consistent interaction patterns, the redesign makes complex monitoring functionality easier to navigate and understand.
What I took from it
- 01Clarity comes from prioritization. Making a complex product easier to use starts with deciding what deserves attention, not simply removing information.
- 02Consistency goes beyond visual design. Shared interaction patterns help users move between different tasks without having to relearn how the product works.
- 03Context makes information useful. Bringing monitoring events together helps users understand the bigger picture instead of interpreting isolated changes.